What does that mean?
Data visualization on maps has changed our lives. We will orient ourselves much faster in space, but also in complex phenomena.
How? We don’t have to search tables and study long texts. We click on the map and colored icons, signs and elements immediately reveal to us what is happening at exact locations.
Some organizations already have maps in their systems, but only GIS specialists use them. Others have spatial data but do not know how to use it effectively. Others know that thousands of sets of spatial data are freely available from various sources, but they do not know how to get to them and use them.
„So far, there has been a lack of practical tools for searching, processing, and using map data easily. with correct data visualization for easier, faster and more comfortable work,“ sais Radovan Hilbert, Director of Business Development at YMS.
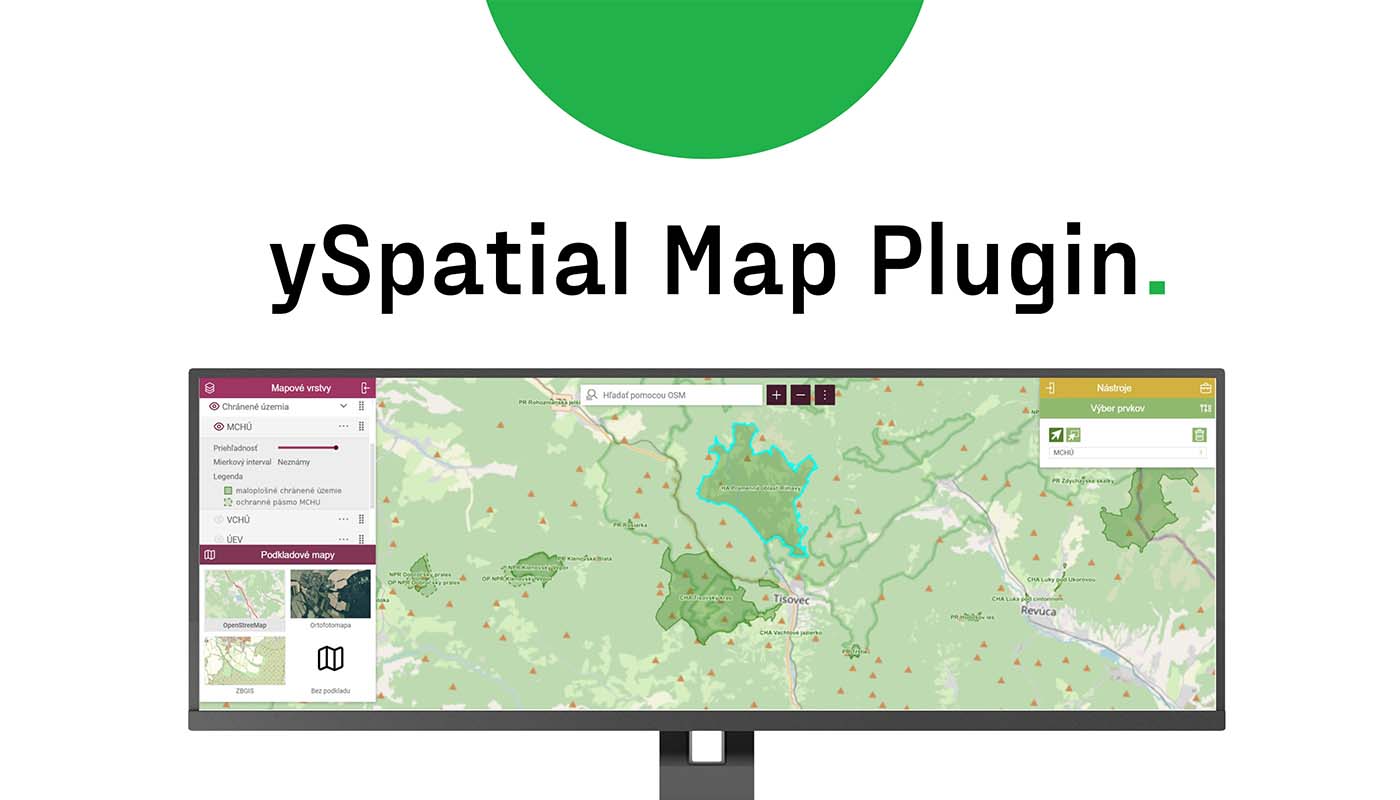
ySpatial Map Plugin – Smart map window “fits” into any system
That’s why we developed and are constantly improving our ySpatial MapPlugin, an independent smart map application suitable for any system, both technologically and functionally. It is the younger sister of the robust GIS system ySpatial, which we has been our hallmark for 35 years.
„For 35 years we know perfectly the needs of GIS users. We also know what a smart map application needs to be easy to use and rich in functions. In addition, we find the right free data sets for each client,“ continues Radovan Hilbert.
ySpatial Map Plugin is an excellent and desirable alternative to two commonly known options: a robust GIS, demanding expertise and investment in a new system, and simple Google maps without Slovak data and with very limited functionality.
„Introducing a map plugin means simply inserting a smart map window into an existing system. It contains several dozens of ready-made base maps, which we connect to your or freely available data and configure editing and visualization functions.“ sais biznis analyst Peter Bobáľ.
All employees can use the map plugin without training.
„The application is universally applicable, ergonomic, and intuitive. Users click into the map window or into their system. Changing the information in the map causes a change in the system and vice versa. All changes are automatically written to the database and new information is immediately available to everyone,“ continues Peter Bobáľ.
ySpatial MapPlugin – Smart map window with dozens of editing functions
Almost every piece of data can be linked to a location in space or on Earth. Therefore, it is natural to display the data on the map. This brings the perception of data in a wider context.
„The map plugin contains a tree of background maps with legends, which the user can arrange according to his needs. It can measure areas and routes on the map, localize objects, filter objects, change descriptive data, change marker colors, search, export the map, and print. Take attribute values, get coordinates, and do many other things. All these changes will be reflected in the system itself, through the map,“ closes Peter Bobáľ.
_____________
ySpatial MapPlugin can be connected to any system. We have an ESRI and an Open Source solution. both are universally applicable with dozens of customizable map layers and features. We help with finding, sorting, and connecting freely available spatial datasets from various sources.


